Single-cell mRNA sequencing (scRNA-seq) allows to profile heterogeneous cell populations, offering exciting possibilities to tackle a variety of biological and medical questions. A range of methods has been recently developed, making it necessary to systematically compare their sensitivity, accuracy, precision and cost-efficiency.
Here, researchers from Ludwig-Maximilians University have generated and analyzed scRNA-seq data from 479 mouse ES cells and spike-in controls that were prepared with four different methods in two independent replicates each. They compare their sensitivity by the number of detected genes and by the efficiency with which they capture spiked-in mRNAs, their accuracy by correlating spiked-in mRNA concentrations with estimated expression levels, their precision by power simulations and variance decomposition and their efficiency by their costs to reach a given amount of power.
Schematic of the experimental and computational pipeline
Mouse embryonic stem cells cultured in 2i/LIF and ERCC spike-in RNA were used to prepare single-cell RNA-seq libraries. The four methods differ by the presence and length of a unique molecular identifier sequence (UMI) allowing to identify reads generated during cDNA amplification. Data processing and subsetting of cells was done comparatively for all methods. Final cell numbers per method and replicate are shown with their mean sequencing depth. Colors represent the compared scRNA-seq methods: purple – CEL-seq, orange – Drop-seq, green SCRB-seq, blue – Smart-seq and are used throughout this study.
While accuracy is similar for all methods, the researchers found that Smart-seq on a microfluidic platform is the sensitive method, CEL-seq is the precise method and SCRB-seq and Drop-seq are the efficient methods. This analysis provides a solid basis to choose among four available scRNA-seq methods and to benchmark future method development.
Sensitivity of scRNA-seq methods
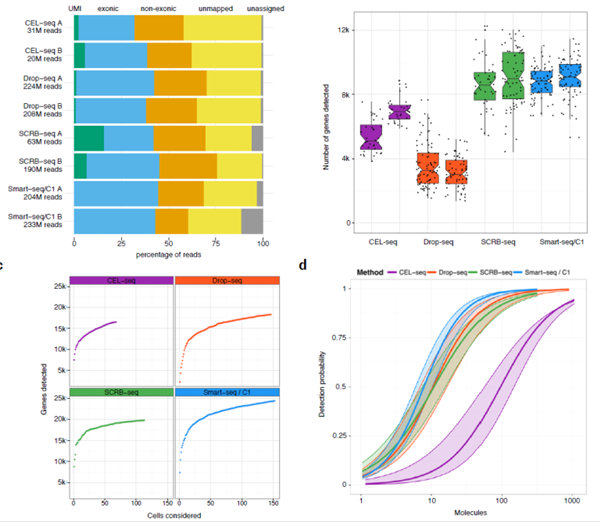
(a) Percentage of the total reads that can not be assigned to a cellular barcode (grey), can not be mapped to the mouse genome (yellow), are
mapped to regions outside exons (orange), inside exons (blue) and carry a unique UMI (green). (b) Number of genes with at least one read in all cells with more than 100,000 total reads in total. Each dot represents a cell and each boxplot represents the median, first and third quartile per replicate and method. (c) Cumulative number of genes detected as more cells are added. (d) Sensitivity per method estimated as the probability to detect ERCC transcripts dependent on their copy number per cell. The 95% confidence interval of an estimate is displayed as shaded area.
上一篇:Inertial-ordering-assisted droplet microfluidics for high-th
下一篇:Single cell sequencing sheds light on why cancers form in sp


